| Contents: |
|

The Control Loop Assistant (CLA) software developed by Lambda Controls is designed to accomplish three main tasks in optimizing control loops:
The key to accomplishing these tasks is that several (perhaps as many as a dozen or more) manual bump tests must be performed on the loop. For further details see Control Loop Health and Controller Tuning Background. The CLA software is designed to analyze these bump tests quickly and easily and to summarize the process model results and to calculate controller tuning.
The Control Loop Assistant software makes it easy to accomplish all these control loop performance maintenance tasks through a user-friendly software interface logically organized for this purpose. The software will appeal to instrument technicians working in a maintenance environment where many control loops must be managed. The bump test data is presented using high quality graphs, which feature zooming using mouse dragging, smart auto-scaling and convenient manual scaling if desired. Individual bump tests are identified and marked by dragging bump windows over each bump test. A process model for each bump test is obtained by dragging a process model response curve to best fit the observed bump test data. The Lambda Tuning method is used to calculate the controller tuning constants once all the bump tests have been analyzed.

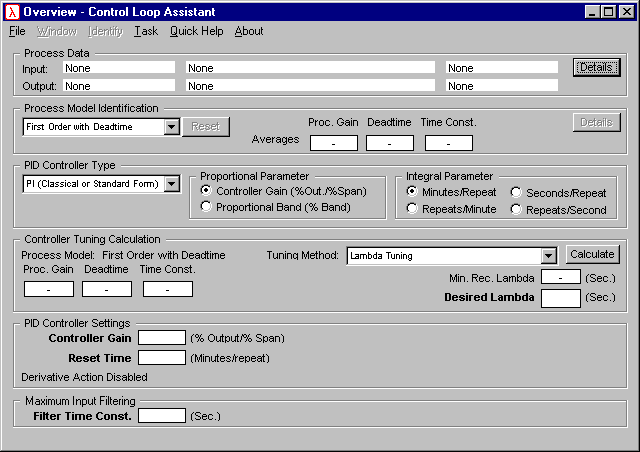
When the software is started the user is presented with an overview page (Fig. 1) that displays the steps required to analyze the bump test data and tune the control loop if appropriate.

Fig. 1. Opening Screen
Data can be imported into CLA from ASCII text files with single or multiple columns. Header information describing the data (loop tag and description, sample interval, engineering unit scaling, etc.) is made use of wherever possible. Data files in CSD format produced by Innovention Industries' Data Logger can also be imported.
If the loop detail information is not supplied or is incorrect the fields presented can be editing as you would a spread-sheet, as shown in Fig. 2.
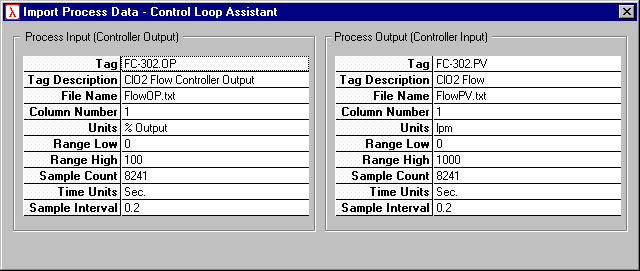
Fig. 2 Importing Data into Control Loop Assistant
After data has been read in, the next step is to mark the locations of each of the bump tests in the data. This is referred to as Windowing the bumps and is shown below.
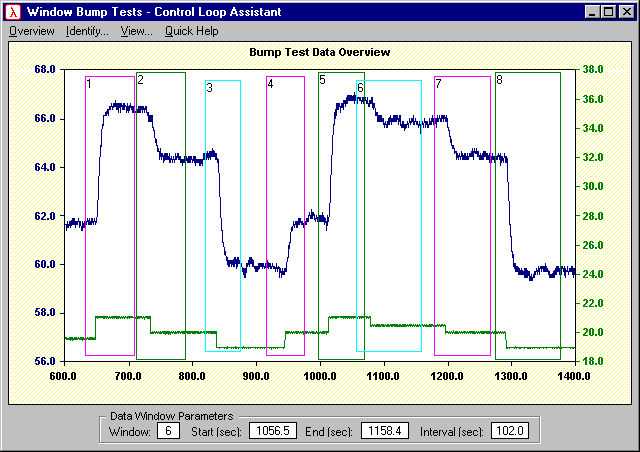
Fig. 3. Defining Data Windows for each Bump
Both the Process Variable (PV) (shown in Blue) and the Controller Output (shown in Green) are displayed on a single graph with a left scale (Blue) used for the Process Variable and the right scale (Green) used for the Controller Output. Both variables are expressed in percent units.
Additional bump windows can be added as required. Each of the Individual bump windows can be selected, moved around on the screen and resized by dragging either the whole window or the left or right edge with the mouse. The final state that the Data Windows are left in defines the desired specification of the Data Windows.
For the bump test process data shown in Fig. 3, note that the amount of change in the PV varies from bump to bump even though the size of the step change in the Controller Output is the same. This indicates the presence of a nonlinearity called backlash, normally resulting from a poorly maintained or poorly performing control valve.
Next each of the bump tests needs to be inspected for control loop nonlinearities or to develop a process model. At present two linear process models are supported: (i) First Order with Deadtime model (Fig. 4) (ii) Integrator with Deadtime (Fig. 5).
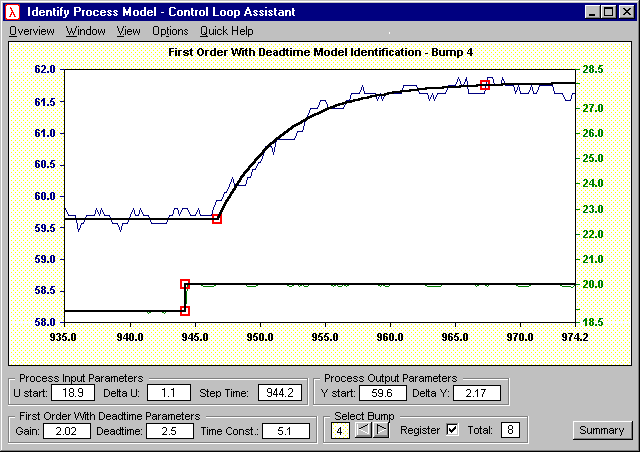
Fig. 4. Fitting a First Order with Deadtime Model to the Bump Test Data
A step input and the process model response are overlaid on the bump test data, with a rough fit of the model to the data. The square grab handles shown in Red above can be dragged on the screen using the mouse to obtain the best fit of the model to the data. As the grab handles are moved the process model parameters update to the new values. Bumps are selected using the Forward or Reverse command buttons shown in the Select Bump Frame. The bump can selected to be either registered for model identification or not with the Register check box.
The identification of an Integrator with Deadtime Model, shown in Fig. 5, is most commonly used to model a tank level process response.
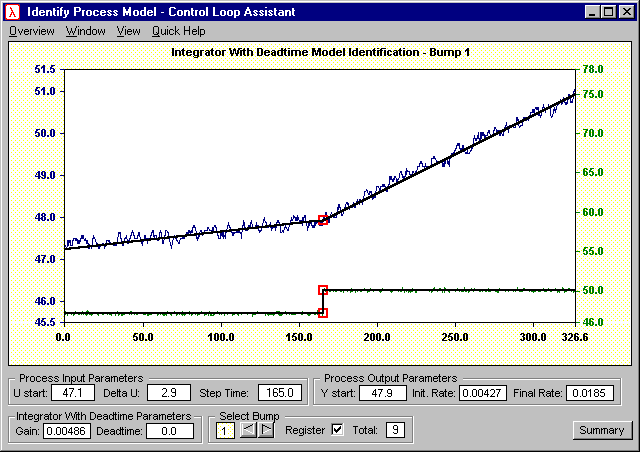
Fig. 5. Fitting an Integrator with Deadtime Model to the Bump Test Data
Once a model has been fitted to each of the bump tests, the results can be reviewed in the Process Model Identification Summary page shown below.
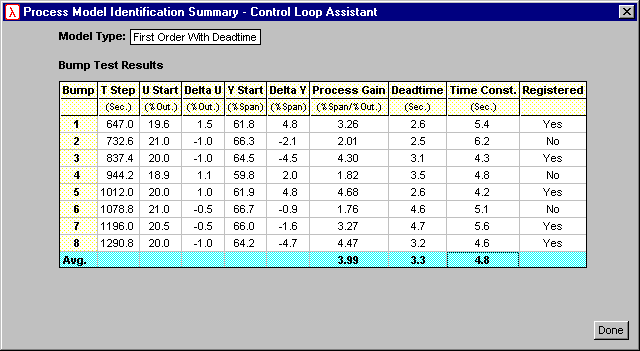
Fig. 6 Bump Test Summary
Once the bump test results have been reviewed, and decisions have been made as to which bumps should be used to develop a process model, the user returns to the main overview page to calculate controller tuning as shown in Fig. 7.
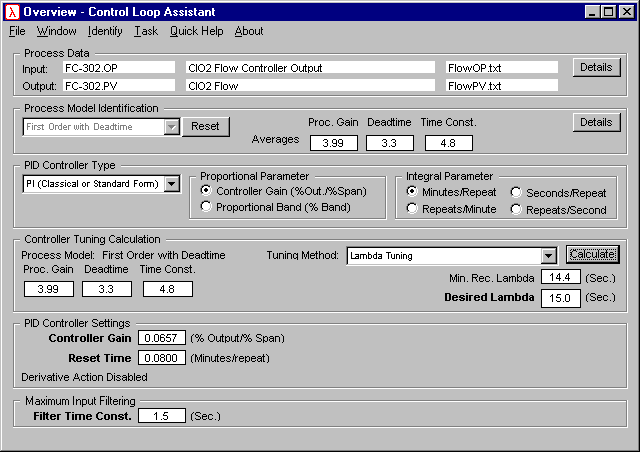
Fig. 7. Selecting a Process Model for Tuning and Calculating Controller Tuning
The average values of the process model parameters are displayed in the Process Model Identification frame on overview page. The average values can be used as the values selected for tuning purposes or adjustments can be made if desired. For example, tuning can be based on the slowest response.
The type of the PI controller must be specified. The common choices for the form of the tuning parameters used in most controllers can be selected from the PID Controller Type frame.
Controller tuning is calculated using the Lambda Tuning method. This tuning method uses the process model parameters and a desired closed loop time constant called Lambda to calculate PI controller settings. The Minimum Recommended Lambda is displayed but the Desired Lambda value must be explicitly selected by the user. Once this value is specified clicking on the Calculate button will display the controller tuning parameters.
It is possible to use the overview page as a stand-alone tuning calculator by simply entering the desired process model parameters, specifying the desired form of the controller and the desired Lambda value and clicking on the Calculate button.
Control loop performance can be compromised for a number of reasons. Two common sources are poor control valve performance and inappropriate controller tuning. An important component of troubleshooting valve problems and selecting controller tuning constants is to perform dynamic response tests (step tests) usually called bump tests. During the bump test, process data consisting of the Process Variable (PV) and the Controller Output is collected and step changes in the Controller Output are accomplished using the Controller.
Bump tests serve two main purposes: (i) evaluating control valve dynamic non-linearities, such as backlash, stiction, variable deadtime, etc. which are the usual sources of poor valve performance and (ii) determining a dynamic system model for the process (process model) which is used to calculate controller tuning for the control loop.
Bump tests to evaluate control valve performance will involve making fairly small bumps typically on the order of 1 % Controller Output or even smaller. Also quite a few bumps are required to evaluate the variation of the process model parameters. In practice at least a dozen bumps ranging in size from about 1% Controller Output up to as high as 10% Controller Output are required on typical control loops to accomplish these tasks. Since the bumps made can be quite small in size and quite a few bumps are required, hand analysis of each of these bump tests to determine control loop nonlinearities and/or a process model would represent a considerable investment in time. Lambda Tools CLA is designed as a tool to assist the Instrument Technician or Engineer perform these tasks himself (making the analysis easier and less time consuming). It is important to involve the person maintaining or tuning the loop as much as possible in the decision making required to evaluate the control valve performance, interpret the bump tests in the face of ongoing process disturbances and select the appropriate controller tuning constants.
The steps to evaluate control loop dynamic performance and optimize the loop performance are as follows. First, the individual bumps are identified for further analysis. Each bump test is analyzed to determine the presence of non-linearities and to determine a dynamic system model representing the response. The bump test results should be summarized in table form. The table summarizes process model parameters and/or comments on the non-linearities present. These tables are very helpful in making controller tuning decisions. If the control loop is in sound condition, performance requirements for the control loop are selected and controller tuning constants are calculated. The final step is to generate a report summarizing the bump test findings, the tuning decisions and the final controller tuning selected.
It is preferable to use the Lambda Tuning controller tuning methods popularized over the last decade. This tuning method requires a process model and the specification of a desired closed-loop time constant, called Lambda, to calculate the controller tuning parameters. The selection of Lambda determines the speed of response of the control loop in Automatic mode. Care must be taken to select a Lambda value that will result in robust control system response which supports the overall process objectives required.
LAMBDA CONTROLS, 17 Erbsville Court (RR# 3), Waterloo, ON, Canada N2J 3Z4
Tel.: 519-884-6998, Fax: 519-884-1089
E-mail: inquiries@lambdacontrols.com, Web site: www.lambdacontrols.com